Search News
Industry Portal
Popular Tags
Belt Tension and Friction Metrics: What to Track
Author
Time
Click Count
Belt Tension and Friction Metrics: What to Track as Automation Standards Rise
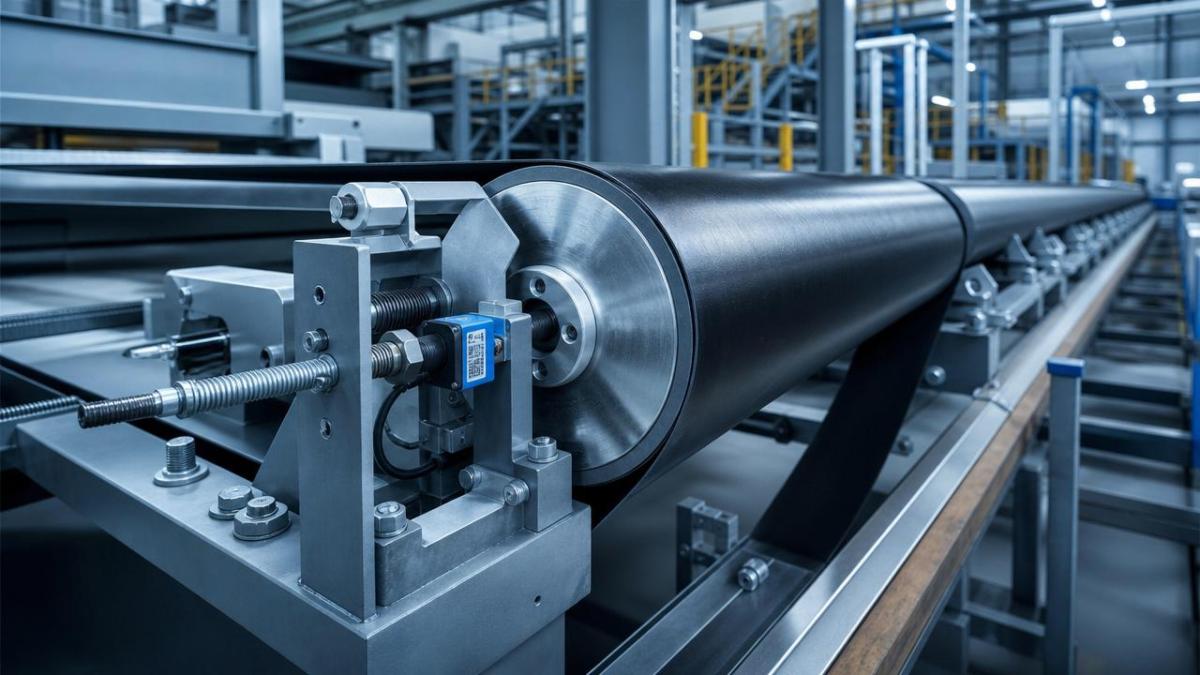
For technical evaluators assessing conveyor, drive, or power transmission systems, belt tension and friction metrics are critical indicators of reliability, energy efficiency, and lifecycle cost.
In advanced industrial environments, small deviations in tension, slip, or surface interaction can signal emerging wear, misalignment, or process instability.
This article outlines which metrics matter most, how they influence operational performance, and why standardized measurement supports smarter benchmarking and predictive maintenance.
Why Belt Tension and Friction Metrics Are Becoming Strategic
Automation is increasing the cost of small mechanical errors.
A belt that once tolerated variation may now disrupt synchronized robotics, machine vision timing, or high-speed packaging flows.
That shift makes belt tension and friction metrics more than maintenance data.
They are now operational signals for throughput stability, energy loss, product quality, and asset health.
The change is visible across general industry, logistics, food processing, mining, electronics assembly, and automated warehouses.
Systems are expected to run longer, faster, and with fewer manual interventions.
In this environment, belt tension and friction metrics help translate physical behavior into measurable industrial intelligence.
Current Trend Signals in Belt-Driven Systems
Several signals show why measurement expectations are changing.
First, energy reporting is moving from facility level toward machine and component level.
Second, predictive maintenance platforms need clean mechanical indicators, not only motor current or temperature alarms.
Third, supply chains now compare equipment performance through lifecycle cost, not only purchase price.
These trends increase demand for repeatable belt tension and friction metrics across sites, suppliers, and operating conditions.
Key Metrics Now Under Closer Observation
- Static belt tension before startup.
- Dynamic belt tension during load changes.
- Coefficient of friction between belt and pulley.
- Slip percentage under acceleration and peak torque.
- Elongation rate over service intervals.
- Surface temperature at contact zones.
- Vibration patterns linked to misalignment.
- Wear depth, glazing, contamination, and surface roughness.
Together, these belt tension and friction metrics reveal whether power transfer is efficient, stable, and sustainable.
Forces Driving the Shift Toward Standardized Measurement
The rising importance of belt tension and friction metrics is not accidental.
It reflects a wider move toward measurable, comparable, and digitally traceable industrial assets.
The same belt can perform differently across humidity, dust, temperature, speed, and load profiles.
That is why single-point tension readings are becoming insufficient for advanced evaluation.
How Belt Tension Shapes Reliability and Energy Use
Belt tension determines how effectively force is transmitted between pulleys, rollers, shafts, or driven equipment.
When tension is too low, slip increases, heat rises, and motion accuracy declines.
When tension is too high, bearings, shafts, seals, and belt cords face unnecessary stress.
Balanced belt tension and friction metrics help identify the operating window between under-driving and overloading.
Tension Metrics Worth Tracking
- Initial installation tension after alignment.
- Running tension at nominal load.
- Peak tension during startup, braking, or jams.
- Tension decay after running-in periods.
- Left-right tension balance on wide belts.
- Tension recovery after load release.
These belt tension and friction metrics support trend analysis instead of reactive correction.
They also help separate installation issues from material aging or process changes.
Why Friction Data Is Moving Beyond Basic Slip Checks
Friction is often treated as a fixed property, but real systems rarely behave that simply.
Surface condition, pulley coating, contamination, moisture, speed, and temperature can all change friction behavior.
That variability makes friction measurement essential for high-reliability operations.
Effective belt tension and friction metrics should show not only whether slip exists, but why it appears.
Friction Indicators With Practical Value
- Static coefficient of friction at rest.
- Dynamic coefficient of friction during operation.
- Slip onset load under controlled acceleration.
- Pulley lagging grip degradation over time.
- Friction changes after cleaning or lubrication exposure.
- Contact temperature during sustained duty cycles.
Monitoring these values helps prevent hidden energy loss and unexpected throughput variation.
Impact Across Operations, Maintenance, and Procurement Decisions
The business impact of belt tension and friction metrics extends beyond maintenance teams.
Operations gain better process stability, especially where conveyors interact with sensors, sorters, fillers, cutters, or robots.
Maintenance teams gain clearer root-cause evidence before replacing belts, pulleys, bearings, or motor components.
Procurement functions gain a more accurate basis for lifecycle comparison between belt materials, drive designs, and supplier specifications.
Where the Effects Are Most Visible
- High-speed conveyors requiring consistent product spacing.
- Heavy-duty drives exposed to shock loading.
- Cleanroom or food-grade systems with strict contamination limits.
- Automated warehouses using long operating hours.
- Precision assembly lines requiring repeatable motion transfer.
In each case, belt tension and friction metrics connect mechanical condition with broader production performance.
Measurement Practices That Improve Benchmarking Quality
Reliable data depends on consistent measurement practice.
A tension reading taken under unknown load, temperature, or belt age can mislead decision-making.
For meaningful belt tension and friction metrics, test conditions should be documented with enough detail for comparison.
Recommended Data Context
- Belt type, construction, compound, and age.
- Pulley diameter, surface finish, and lagging material.
- Ambient temperature, humidity, dust, and washdown exposure.
- Load profile, speed range, and duty cycle.
- Measurement instrument, calibration status, and method.
- Operating state, including startup, steady run, and shutdown.
This context turns isolated measurements into comparable technical evidence.
Core Focus Areas for Future-Ready Industrial Teams
As equipment becomes more connected, belt tension and friction metrics should be integrated into asset intelligence models.
The goal is not to collect more data, but to collect useful data with decision value.
Priorities to Track
- Define acceptable tension ranges by application, not by generic habit.
- Measure friction under realistic load, speed, and environmental conditions.
- Link slip events with motor current, vibration, and temperature data.
- Compare belts by retained performance after aging, not only initial values.
- Create alarms based on trend deviation, not only fixed thresholds.
- Use standardized records to support supplier and system benchmarking.
These priorities help convert belt tension and friction metrics into measurable operational resilience.
Practical Response Framework for the Next Upgrade Cycle
Industrial systems rarely improve through measurement alone.
The value comes from linking measurement to actions, responsibilities, and technical thresholds.
This framework supports disciplined decision-making across both new installations and retrofit projects.
What to Watch as Materials and Intelligent Automation Converge
The next trend is the convergence of material science, sensing, and vertical industrial AI.
Belts may be evaluated not only by strength, but by data stability under changing duty cycles.
Advanced compounds, engineered surfaces, and smart monitoring tools will change how systems are specified.
In that future, belt tension and friction metrics become part of a wider digital performance profile.
This profile can support predictive models, sustainability reporting, and standardized technical benchmarking.
Decision Signals to Monitor
- Does the belt maintain tension after thermal cycling?
- Does friction remain stable after contamination exposure?
- Does slip increase before visible wear appears?
- Does energy consumption improve after tension optimization?
- Does supplier data match in-field operating behavior?
These questions keep belt tension and friction metrics aligned with real industrial outcomes.
Action Steps for More Reliable Belt Performance
Start by building a baseline for the most critical belt-driven assets.
Record installation tension, running tension, slip behavior, friction condition, and surface temperature under normal load.
Then connect these readings with downtime events, energy use, and replacement history.
Over time, belt tension and friction metrics will reveal which assets need redesign, retensioning, cleaning, or specification changes.
For industrial benchmarking, use standardized methods and document operating context before comparing suppliers or materials.
This approach turns routine belt checks into a practical intelligence layer for modern automated production ecosystems.
Recommended News
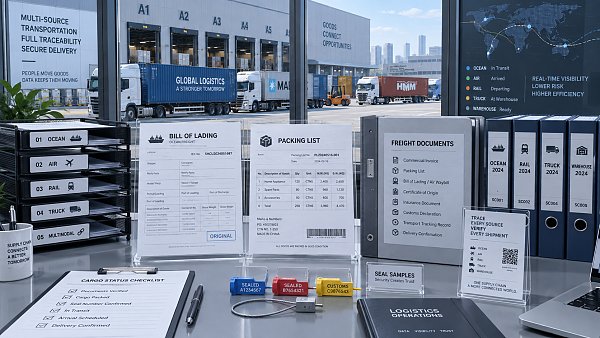
 Sep 19, 2026When can a supply chain LLM reduce time spent finding shipment updates?Supply chain LLMs can cut shipment-update search time by connecting carrier events, ERP data, and documents—giving teams traceable answers and faster exception response.
 Sep 18, 2026How industrial monitoring equipment helps prevent unplanned downtimeIndustrial monitoring equipment helps teams detect early asset issues, prioritize maintenance, and prevent costly unplanned downtime. Explore practical strategies for reliable operations.
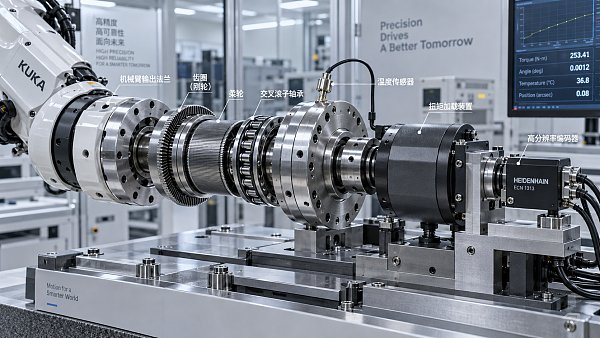
 Sep 17, 2026What next-gen harmonic drive research means for robot joint accuracyNext-gen harmonic drive research reveals how backlash, stiffness, thermal drift, and sensing shape robot joint accuracy. Explore smarter validation strategies.
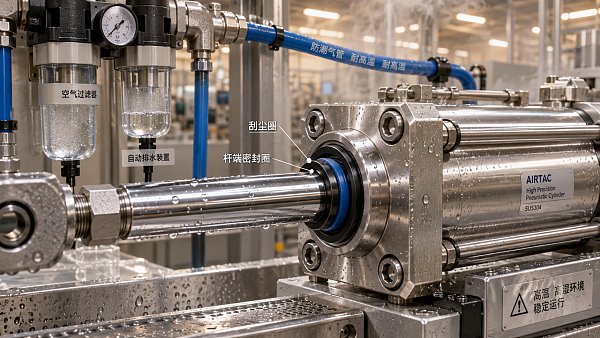
 Sep 16, 2026How Southeast Asian climates affect cylinder seal frictionCylinder seal friction Southeast Asia: learn how humidity, heat, monsoons, and contamination affect motion stability, wear, and seal selection.
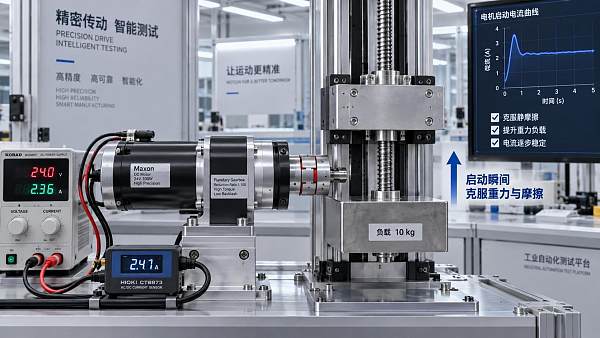
 Sep 15, 2026How to size DC gear motors for the required starting torqueGear motors DC sizing made practical: calculate starting torque, account for friction, gravity, inertia and voltage drop, then select a reliable motor with confidence.
 Sep 14, 2026How to verify high purity chemicals compliance before supplier approvalHigh purity chemicals compliance: learn how to verify supplier quality systems, CoAs, traceability, testing, and change control before approval.
 Sep 13, 2026What permits are needed to operate mapping drones in Europe?Mapping drones Europe: discover the permits, EASA categories, airspace approvals, site access, and GDPR checks needed for compliant aerial surveys.
 Sep 12, 2026What lead time should I expect for automatic transmission components? Planetary Gearboxes delivery forecasting for OEM planningWhat lead time should I expect for automatic transmission components? Get dynamic, AI-powered planetary gearbox delivery forecasting—designed for OEMs building next-gen hybrid & commercial powertrains.
 Sep 12, 2026Can polyamide replace metal in load-bearing components? Polymer Pulse structural performance data for 2026 applicationsCan polyamide replace metal in load-bearing components? Discover Polymer Pulse’s 2026 structural data—real-world performance, weight savings, and reliability breakthroughs.
 Sep 12, 2026How to handle a power electronics warranty claim: Harmonic Reducers documentation and escalation pathHow do I handle a power electronics warranty claim? Get a fast, intelligent, evidence-driven resolution for harmonic reducers—no bureaucracy, just precision diagnostics and real-time escalation.
 Sep 12, 2026Which motion control specifications matter most before purchase? Torque Logic selection criteria for automation engineersWhich motion control specifications are most important before purchase? Discover Torque Logic—the 4 non-negotiable, AI-aligned criteria that cut TCO by 27–41% and boost motion system availability to 99.992%.
 Sep 13, 2026Is agentic AI reliable enough for supplier screening? Supply Chain LLM validation framework for procurement teamsIs agentic AI reliable enough for supplier screening? Discover a rigorous LLM validation framework built for procurement teams—grounded in material traceability, regulatory compliance, and real-world operational constraints.
 Sep 14, 2026How to maintain edge AI systems after deployment: Predictive Maint AI operational protocols for field techniciansHow do I maintain edge AI systems after deployment? Discover predictive, physics-aware operational protocols designed for real-world field technicians—sustaining intelligence where silicon meets steel.
 Sep 15, 2026What compliance documents must a bioplastics supplier provide? Bio-Plastics regulatory checklist for procurementWhat compliance documents should a bioplastics supplier provide? Get our actionable regulatory checklist for food, medical & EU-bound applications.
 Sep 16, 2026How to prevent PET film defects during production: Barrier Films process control best practicesHow can I prevent PET film defects during production? Discover physics-driven barrier film process control—thermal precision, dynamic tension management & surface energy optimization.
 Sep 17, 2026Are thermoplastics suitable for long-term outdoor use? Engineering Resins durability assessment in 2026 UV/weather exposureAre thermoplastics suitable for long-term outdoor use? Discover 2026’s engineering resin durability insights — UV/weather resistance ranked, tested & actionable.
 Sep 18, 2026What to do when a servo motor fails during production: A Servo Actuators troubleshooting guide for maintenance teamsWhat should I do if a servo motor fails during production? Get a field-tested, AI-aware troubleshooting guide for maintenance teams—minimize downtime, maximize OEE.
 Sep 12, 2026How to compare wholesale party supplies by minimum order valueCompare wholesale party supplies by minimum order value, freight, SKU flexibility, and stock risk to choose suppliers that protect margins and simplify replenishment.
 Sep 11, 2026How proportional solenoid linearity affects precision motion controlProportional solenoid linearity directly affects precision motion control, valve metering, stability, and calibration. Learn how to evaluate performance for reliable automation.
 Sep 10, 2026When does supplier information platform automation reduce onboarding delays?Supplier information platform automation reduces onboarding delays by streamlining data collection, routing, renewals, and compliance checks—without replacing expert technical review.
 Sep 09, 2026How to size robotic motion systems for AMR payload changesRobotic motion systems for AMR payload changes: learn how to size motors, wheels, gearing, traction, and controls for safer, reliable performance.
 Sep 08, 2026How to perform a cylinder rod buckling calculation for long strokesCylinder rod buckling calculation made practical: learn how to assess effective length, end conditions, rod stiffness, load forces, and safety margins for reliable long-stroke cylinder design.
 Sep 07, 2026How to estimate the cost of industrial mechanical components before orderingIndustrial mechanical components cost: learn how to estimate material, machining, tooling, inspection, logistics, and hidden expenses before ordering. Compare quotes confidently and reduce sourcing risk.
 Sep 07, 2026What Is a Product Standards Database Used For?Product standards database guide: learn how to compare requirements, verify revisions, control specifications, and reduce compliance risks across design, sourcing, and production.